Variance
Variance is a measurement of the spread between numbers in a given data set.
Below is the formula to calculate Variance ,just remember we need to use n-1(where n is count of observations/population/sample) in when we are using sample (click here to know about Sample vs Population).
Standard deviation:
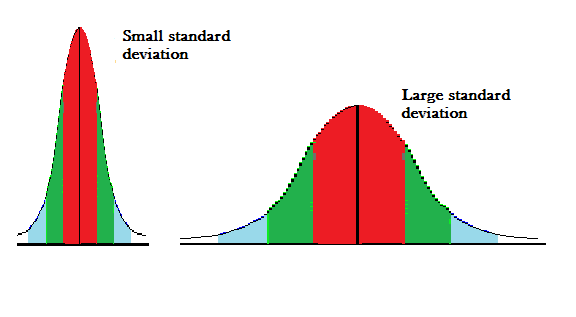
Standard deviation measures the spread of a data distribution. The more spread out a data distribution is, the greater its standard deviation.
Click her to know more about distributions.
standard deviation is equal to the square root of the variance:
Below are the formulas to calculate the Variance and Standard deviation

Where
- X is individual one value
- N is size of population
- x̄ is the mean of population
Lets calculate Variance and Standard Deviation:
Let’s take the below dataset of ages for students.
Ages = (10,11,12,14,11,16,18,13,15,90)
Calculating Variance:
- Mean of our dataset = 10+11+12+14+11+16+18+13+15+90/9 = 21
- Find the distance from Mean to each data point
((10-21),(11-21),(12-21),(14-21),(11-21),(16-21),(18-21),(13-21),(90-21),(15-21)) = (-11,-10,-9,-7,-10,-5,-3,-8,69,-6)
- Square the difference= (121,100,81,49,100,25,9,64,4761,36)
- Variance = Mean of squared Difference = 121+100+81+49+100+25+9+64+4761+36/10 = 534.6
Calculating the Standard Deviation:
It is very straightforward Square root of variance is Standard Deviation.
SD = sqrt(534.6) = 23.12142
Coefficient of variation:
Some points to remember:
- If variance is high, that means you have larger variability in your dataset. In the other way, we can say more values are spread out around your mean value.
- Standard deviation represents the average distance of an observation from the mean
- The larger the standard deviation, larger the variability of the data.

One thought on “Variance and Standard Deviation”